


Your website is often the first point of interaction between your brand and potential customers. But having a professional-looking website isn't enough to get the customers you need. To drive growth and conversions and improve user experience, you need to measure how people interact with your site.
Analytics for website is one such gateway that can provide your brand with more than just an online presence. It can help you track and understand how visitors interact with your website, enabling data-driven decisions that drive business growth.
This guide covers everything you need about website analytics, from the basics to the tools, key metrics, and how to make data-driven decisions.
What is Website Analytics?
Website analytics collects, measures, and analyzes data related to your website’s performance and user behavior. It reveals insights like:
- Who visits your website: Demographics, devices used, location
- How they find it: Via search engines, social media, email campaigns, etc.
- What they do: Which pages they visit, how long they stay, what they click
- What actions they take: Sign-ups, purchases, downloads, or other goals
This data provides a comprehensive view of your site’s performance and user experience. By identifying what's working and what isn't, you can optimize the site to serve your goals better—generating leads, selling products, or growing traffic.
Think of it like this: your website is like a store, and website analytics is the security camera, cash register, and customer feedback form all rolled into one. It tells you how many people visited, where they came from, what pages they looked at, how long they stayed, and whether they took the actions you wanted—like filling out a form or purchasing.
Why Website Analytics is Important for Your Business
Website analytics isn’t just for data geeks. Anyone responsible for a business or online platform needs to understand analytics error in website. Here's why it is crucial:
1. Improves User Experience
When people land on your site, they expect it to be fast, easy to navigate, and helpful. Analytics gives you the insight to make that happen. By tracking how users move through your site, you can see what’s working and what's causing frustration. Are people getting stuck on a specific page? Are they abandoning their carts halfway through checkout? Are they leaving right after landing on your homepage? Website analytics highlights these pain points so you can fix them.
2. Boosts Conversions
Want more newsletter sign-ups or purchases? Analytics shows where users abandon their journey, allowing you to fix friction points in your funnel and giving you the power to boost conversions. Understanding how users move through your site allows you to spot where they’re getting stuck or dropping off. Whether your goal is to get more sign-ups, sales, or inquiries—analytics helps you get there faster and smarter.
3. Measures Campaign ROI
Running a marketing campaign without tracking ROI is like pouring money into a bucket with a hole—you have no idea what you’re actually gaining from your investment. Every marketing campaign drives traffic somewhere. Website traffic analytics lets you track the traffic and revenue generated by Google Ads, social media, email, and more. You can see what’s worth your budget by connecting marketing spend with real results. This means you can stop wasting money on underperforming campaigns and double down on the ones that deliver.
4. Informs Content Strategy
Website analytics takes the guesswork out of content strategy. It shows you which blog posts get the most traffic, how long people stay on each page, what topics they’re most interested in, and what type of content drives conversions. Therefore, by identifying high-performing content, you can double down on similar topics or formats your audience finds valuable.
5. Supports Business Growth
Website analytics isn’t just about tracking visitors. It’s a powerful tool that fuels your business growth. By understanding how people interact with your website, you can identify opportunities to improve and scale. Maybe you discover that a particular blog post drives tons of traffic, so double down on similar content. Or maybe your checkout process has a high drop-off rate, so you simplify it and instantly boost conversions. It gives you the agility to respond to what’s working now.
Key Metrics to Track
Focusing on the right metrics is the difference between being overwhelmed and being informed. Here are the core website analytics metrics to monitor:
- Users and Sessions: Users refer to unique visitors, and sessions refer to the number of visits (a user can return multiple times). These metrics help you gauge the size and frequency of your audience.
- Website Traffic: This tells you how many people are visiting your site. You can break it down by overall number of visits, how many individual users visited, and where visitors came from (e.g., Google, social media, email, direct).
- Exit Rate: Exit Rate shows the percentage of people who left your website from a specific page. In other words, it shows how often that page was the last page someone viewed before they left your site.
- Average Session Duration: This tells you how long visitors spend on your site during a session. More time generally means better engagement, though it can vary by industry.
- Pages per Session: This metric shows how many pages users explore in one visit. More pages suggest deeper engagement and curiosity.
- Traffic Sources: Understand where your traffic comes from: organic (search engines), direct (typed URL), referral (links from other sites), social (Facebook, Instagram, etc.), and email/paid campaigns. Knowing this helps you invest in the right channels.
- Top Landing Pages: These are the first pages people see when they enter your site. Optimizing these pages is crucial because they set the tone for the visitor’s entire experience.
- Exit Pages: These are the last pages people view before leaving your site. Knowing where visitors drop off helps you identify friction points in the user journey.
- Device and Browser Information: Knowing whether your audience is on mobile, desktop, or tablet helps you prioritize design and performance improvements.
- Geographic Data: Where are your visitors coming from? This can guide localization, targeting, and content strategy.
- Site Speed: Slow-loading pages can drive people away. Tracking page load times helps you create a smoother user experience.
- Conversion Rate: Track how many users take a desired action (buying a product, filling out a form, signing up). This is your most important success indicator.
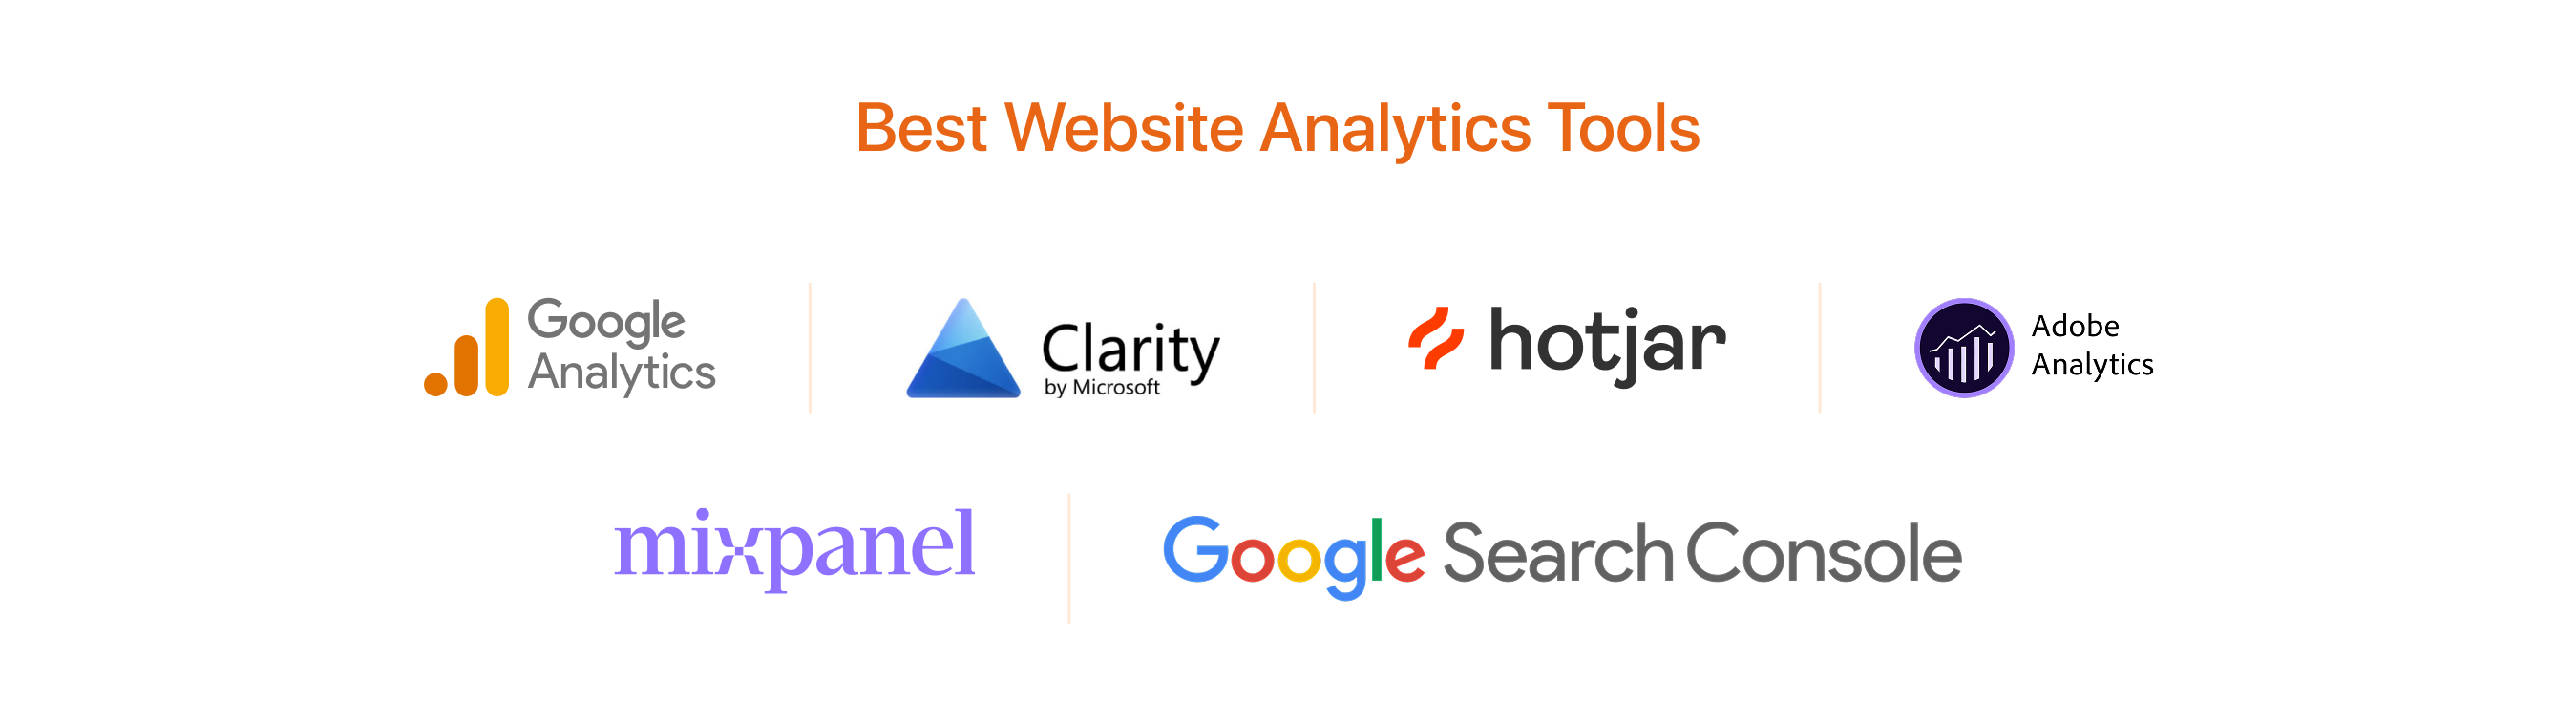
Best Website Analytics Tools
Now, let’s look at some popular website analytics tools to help you get the right insights into your campaigns and website performance.
1. Google Analytics 4 (GA4)
Overview:
GA4 is Google’s latest analytics platform, replacing Universal Analytics. It’s event-based, which tracks user interactions (like clicks, scrolls, downloads) rather than just page views. It offers cross-platform tracking, predictive metrics, and deeper audience insights.
Best For:
- Small to large businesses
- E-commerce, publishers, SaaS companies
- Integrating with Google Ads and Search Console
Key Features:
- Real-time reports
- Cross-device/user journey tracking
- Event tracking without additional code
- Built-in machine learning for insights
- Custom dashboards via Explorations and Looker Studio integration
2. Google Search Console
Overview:
This free tool from Google focuses specifically on your website’s performance in Google Search. It helps identify indexing issues, keyword rankings, click-through rates, and mobile usability.
Best For:
- SEO professionals
- Content marketers
- Webmasters
Key Features:
- Keyword and search performance reports
- Index coverage issues
- Sitemap submissions
- Mobile usability tests
- Core Web Vitals and page experience data
3. Hotjar
Overview:
Hotjar is a behavioral analytics and feedback tool that visualizes how users interact with your site. It provides heatmaps, session recordings, and user surveys to uncover usability issues.
Best For:
- UX/UI designers
- Conversion rate optimization (CRO) teams
- Product managers
Key Features:
- Heatmaps (clicks, scrolls, movement)
- Session recordings
- Surveys and polls
- Funnel analysis
- User feedback widgets
4. Mixpanel
Overview:
Mixpanel is an advanced product analytics platform that goes beyond traditional pageview tracking. It excels at tracking specific user events, cohort analysis, and retention over time.
Best For:
- SaaS companies
- Mobile and web apps
- Product teams focused on user behavior and feature usage
Key Features:
- Custom event tracking
- Funnels and retention analysis
- Cohort and segmentation tools
- A/B testing (via integrations)
- Real-time data analysis
5. Adobe Analytics
Overview:
Adobe Analytics is a premium enterprise-level tool offering deep insights into customer behavior across web, mobile, and other digital platforms. It supports real-time analytics and advanced segmentation.
Best For:
- Large enterprises with complex digital ecosystems
- Retail, banking, and media companies
- Teams with robust technical resources
Key Features:
- Real-time data processing
- Custom dimensions and metrics
- Predictive analytics and anomaly detection
- Multi-channel and cross-device tracking
- Integration with Adobe Experience Cloud
6. Clarity by Microsoft
Overview:
Clarity is a free user behavior analytics tool from Microsoft. It offers heatmaps, session recordings, and performance insights, and works well alongside tools like Google Analytics.
Best For:
- Small to mid-sized businesses
- UX-focused marketers and developers
Key Features:
- Heatmaps (click, scroll)
- Session recordings
- Rage click and dead click detection
- Performance impact analysis
How to Setup Website Analytics
Getting started with website analytics might sound technical, but it's actually pretty straightforward. Here’s a simple step-by-step guide to help you set it up and start tracking your site’s performance:
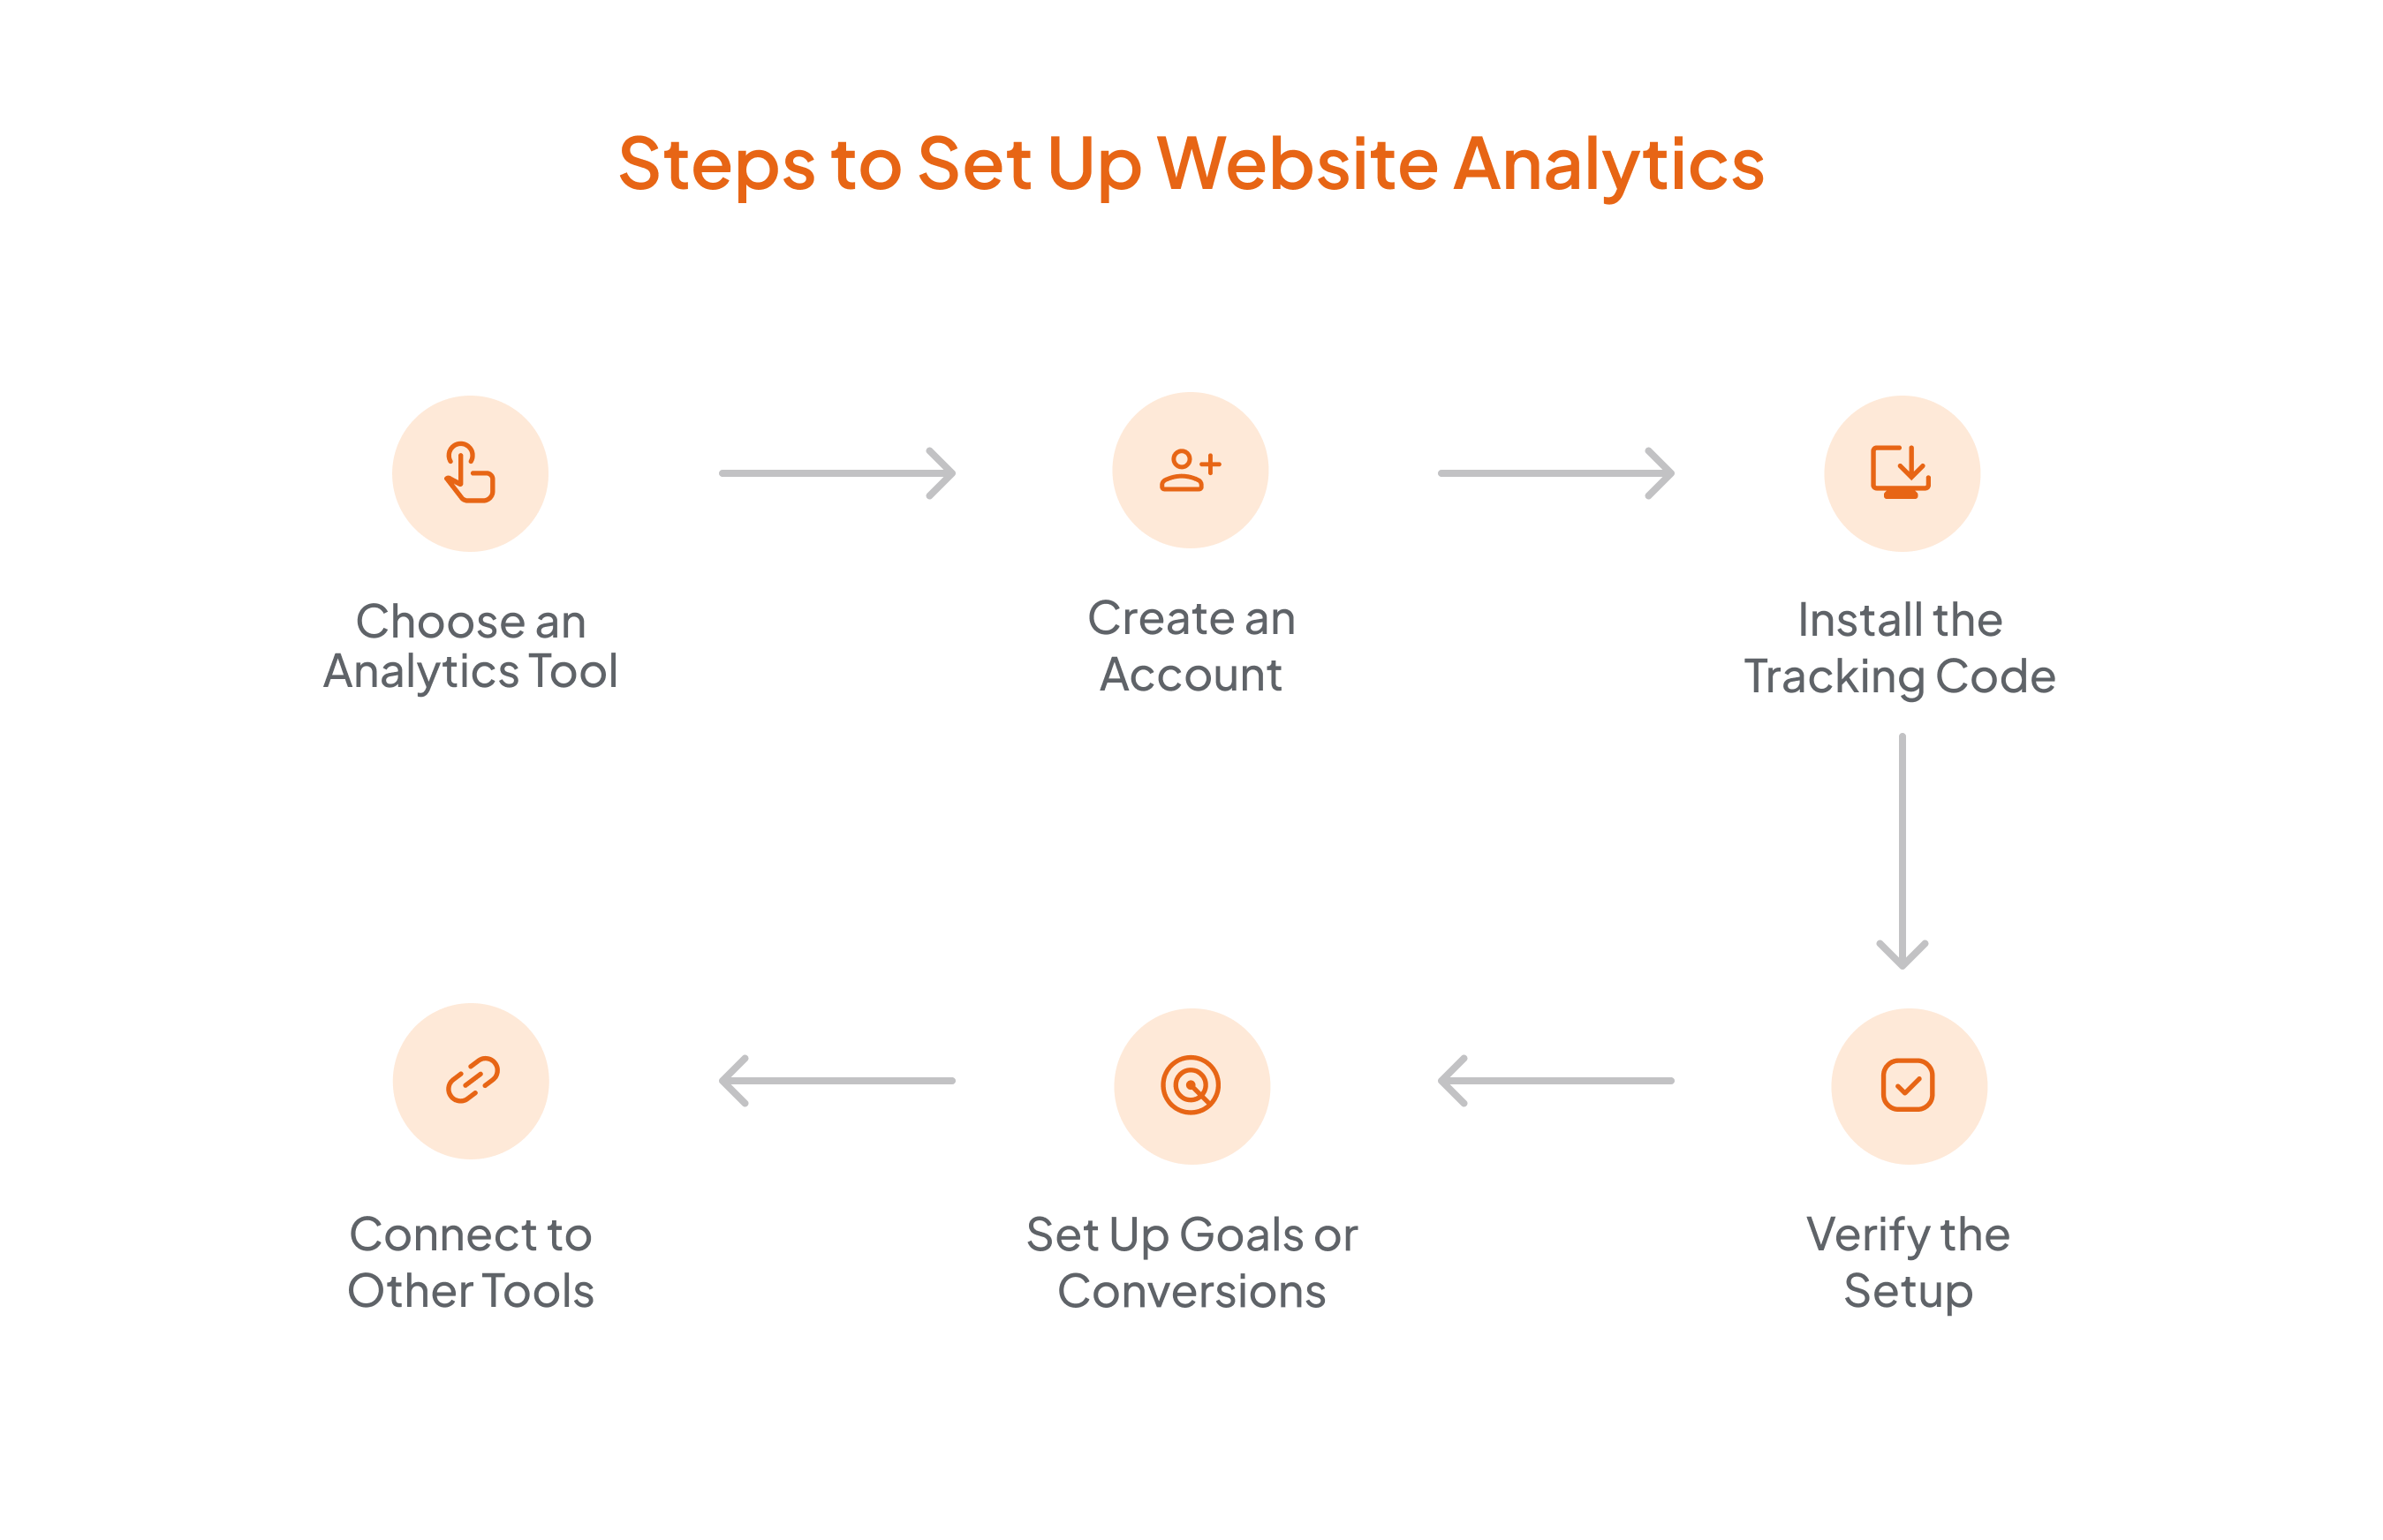
Step 1: Choose an Analytics Tool
The most popular tool out there is Google Analytics. It is free, powerful, and is widely used. Other options include Matomo, Plausible, or Adobe Analytics depending on your needs, especially if you’re looking for more privacy-focused or enterprise-level solutions.
Step 2: Create an Account
For tools like Google Analytics:
- Go to analytics.google.com
- Sign in with your Google account
- Set up a new property (this just means adding your website details)
- Choose whether you want to track a website or an app
Step 3: Install the Tracking Code
Once your property is created, the tool will give you a piece of tracking code (usually JavaScript). You'll need to:
- Copy that code
- Paste it into the <head> section of every page on your website (If you use a CMS like WordPress, Wix, or Squarespace, there are plugins or settings where you can just paste it once.)
Or, if you're using Google Tag Manager, you can add the tracking tag there instead.
Step 4: Verify the Setup
After installation:
- Visit your website
- Go back to your analytics dashboard
- Check if your visit is being tracked (real-time tracking will show at least one user active)
Step 5: Set Up Goals or Conversions
This step helps you track what really matters like form submissions, purchases, or signups. In Google Analytics, you can define goals or set up events to measure these actions. Goals let you measure specific actions that matter to your business. It’s the foundation of smart, data-driven growth.
Step 6: Connect to Other Tools
To get deeper insights, connect your analytics tool with:
- Google Search Console (for SEO performance)
- Google Ads (if you're running campaigns)
- CRM tools or email platforms for complete funnel visibility
Conclusion
Website analytics is more than just a toolset — it’s a mindset. When used effectively, it empowers you to understand your audience, optimize experiences, and achieve your business goals with clarity and confidence.
Whether you're a small business owner, marketer, or product manager, mastering website analytics can transform your digital strategy from guesswork to precision.
If you want a website analytics setup, you can connect with the GAFix.ai team and let the data guide you to smarter decisions.
Frequently Asked Questions
What kind of data does website analytics track?

It typically tracks the number of users and sessions, page views, bounce rate, traffic sources (organic, direct, referral, etc.), conversion actions (form submissions, purchases), user demographics and device types, and on-site behavior (clicks, scrolls, time spent, exit pages).
How do I install Google Analytics on my website?
You can install GA4 in a few steps: First, create a GA4 property in Google Analytics; second, get the tracking code or Measurement ID; third, add the code to your website’s <head> section, or use Google Tag Manager for easier management.
How often should I check my website analytics?
Marketers track campaigns or sales daily or weekly, Business owners or content creators track Bi-weekly or Monthly, and strategic reviews and goal-setting are done quarterly.
Join Our Early Access List & Unlock Exclusive Benefits Now

Subscribe To Our Newsletter


